Lab Results: 12 Numbers That Actually Matter (2026)
Summary & Key Takeaway
A standard blood panel prints more than thirty numbers, and almost every patient walks out of the lab looking at a results page that looks like a spreadsheet from a different planet. The good news: most of the medical signal lives in twelve of those numbers, and once you understand what they measure and what is considered a normal range, the page becomes readable in about ten minutes. This guide walks through those twelve numbers in the order a clinician actually reads them — the complete blood count first, then kidney, liver, metabolic, lipids, thyroid, and vitamin D — with enough context to know when a flagged value is a real concern versus a normal lab variation. The deeper dives for any marker that needs more than a paragraph live in the linked articles in each section.
?? Core Insights
- Of 30+ numbers on a typical blood panel, twelve carry most of the clinical signal doctors act on.
- Read the markers in panels, not in isolation: a slightly low hemoglobin plus a slightly low ferritin tells a different story than either value alone.
- Reference ranges are not the same as optimal ranges, and being 'in range' is not the same as being healthy.
- Three of the twelve — hemoglobin A1c, LDL cholesterol, and eGFR — drive most of the long-term disease-prevention decisions.
- Always ask which version of the reference range the lab used; ranges vary by age, sex, and sometimes race, and a 'normal' flag is a population statistic, not a verdict on you.
- If you want a structured walkthrough before your next appointment, the [How to Understand Your Lab Report Before Your Appointment](/news/understand-your-lab-report-before-appointment/) guide pairs with this one.
Try it yourself — free
Experience the medical AI that powers this article. Ask questions, check symptoms, or analyze lab results.
Want to know what a tool does with a panel like yours? See how the lab interpreter reads a blood panel.
Related Lab Tests
Why Twelve Numbers and Not the Whole Report
Modern automated analyzers produce an enormous amount of detail because they can, not because every number matters equally. Clinicians triage the report by the part of the body each marker reflects, the size of the change from the prior result, and the pre-test probability of disease. A patient can do the same triage in three buckets: cells (the CBC), organ function (kidney and liver), and metabolism (glucose, lipids, thyroid, and vitamins).
The twelve numbers in this guide are the ones that show up in clinical decision-making for the most adults. Specialty tests — inflammatory markers, tumor markers, hormone panels, genetic risk scores — are deliberately excluded because they are ordered for specific reasons and do not belong in a baseline reading. If your report contains extra numbers, do not ignore them; ask which bucket they fall into and whether the order was intentional.
Cells: The Three Numbers in Your CBC
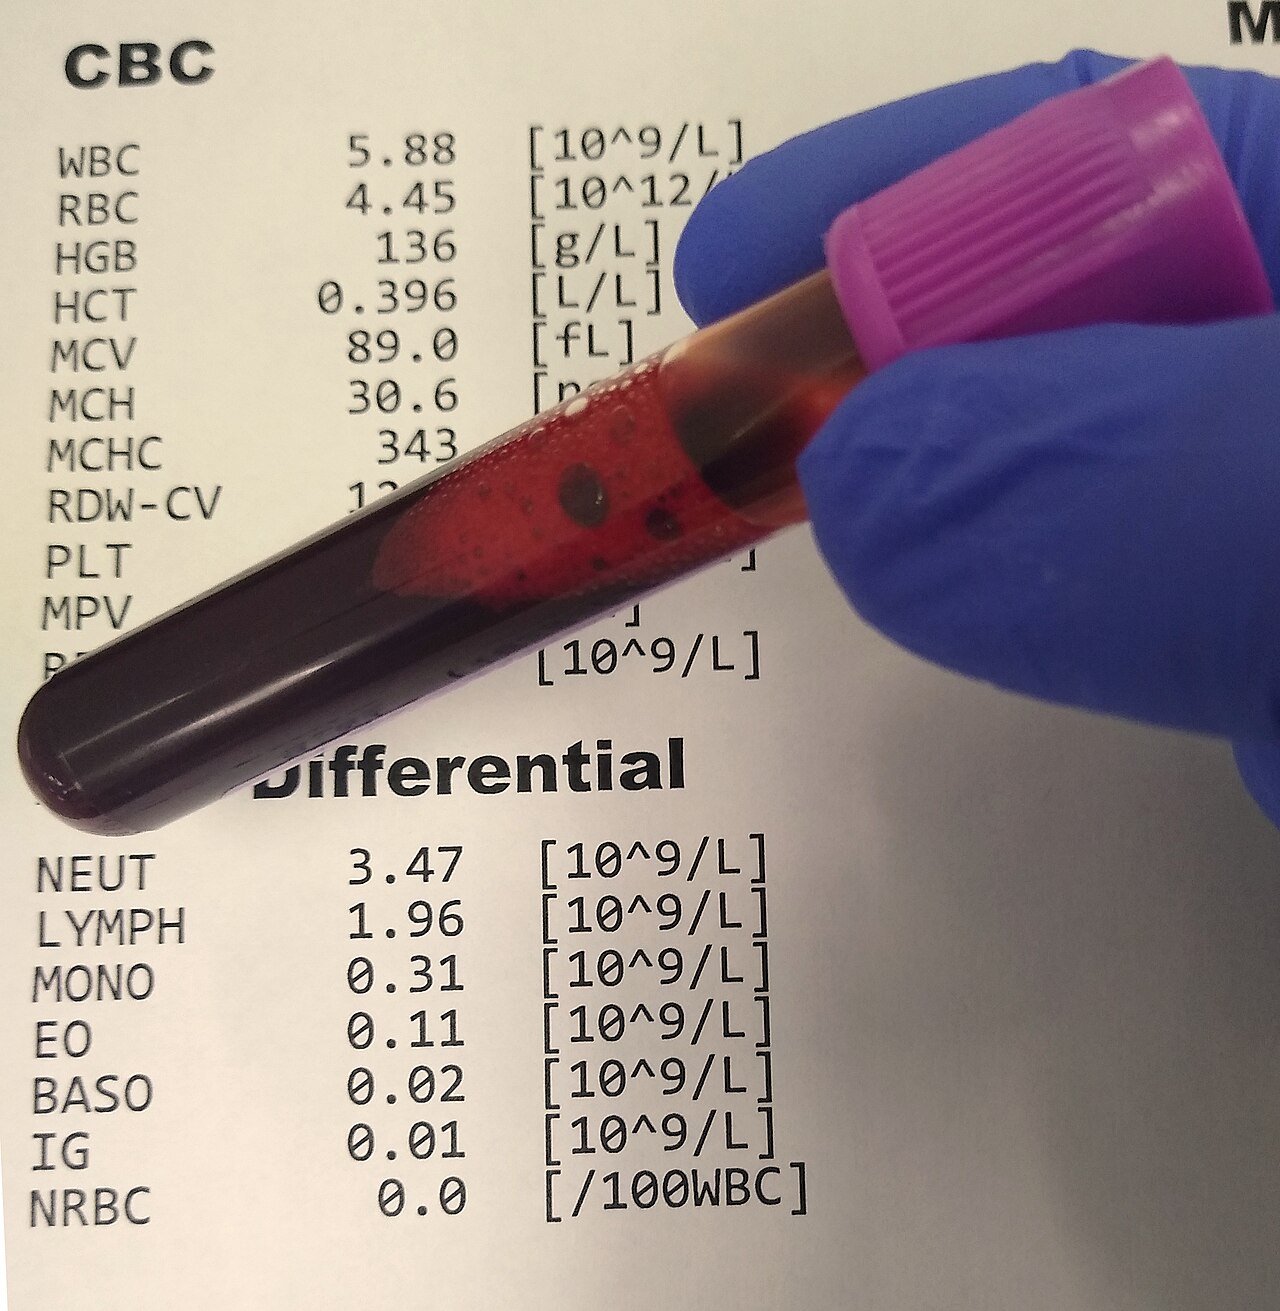
The complete blood count measures the cells that float in your plasma. Hemoglobin is the protein that carries oxygen, and a low value is the definition of anemia; the question that follows is why it is low, which depends on cell size and iron status. Hematocrit is the percentage of blood volume occupied by red cells, and it tracks hemoglobin closely; either alone is usually enough.
White blood cell count is the headline immune number, and the trick is that 'high' or 'low' only matters with a differential — which white cell type is elevated tells the difference between an infection, an allergic response, and a stress reaction. Platelet count measures clotting cells; low values raise bleeding risk, very high values raise clotting risk, and small changes inside the normal range usually reflect hydration rather than disease. For a full breakdown of these three and what their variations mean, the CBC Numbers Decoded walkthrough covers each in detail.
Kidneys: eGFR and Creatinine
Kidney function is summarized by two numbers that say the same thing in different units. Creatinine is a waste product of muscle metabolism that the kidneys clear; it rises in the blood when filtration slows. Estimated glomerular filtration rate (eGFR) is the calculation derived from creatinine, age, and sex, and it expresses kidney function as a percentage of young-adult normal. A value above 90 is reassuring; below 60 for three months is the formal threshold for chronic kidney disease and triggers a closer look at blood pressure, sugar, and protein in the urine.
The detail most patients miss is that creatinine is sensitive to muscle mass and recent protein intake, so a bodybuilder and a sedentary 80-year-old can share a creatinine of 1.1 and have wildly different eGFRs. The Kidney Function Test Results guide walks through how the calculation works and why your number may move between reports without anything being wrong.
Liver: ALT and AST
Two enzymes tell most of the liver story. Alanine aminotransferase (ALT) lives mostly inside liver cells, so an elevated value suggests liver cells are leaking their contents, often from fatty liver, alcohol, medications, or viral hepatitis. Aspartate aminotransferase (AST) is found in liver, muscle, and red blood cells, so it can rise for non-liver reasons; the ratio of AST to ALT helps distinguish alcoholic liver injury from metabolic causes.
Modest elevations — say, ALT in the 50s on a reference range topping out at 40 — are common and frequently benign, but they are worth a second test in three months because persistent elevation has implications even when each individual reading looks mild. The ALT and AST high guide covers when to worry, when to watch, and when to act.
Metabolism: Glucose, HbA1c, and Fasting Status
Glucose is the immediate blood-sugar snapshot, and it moves hour to hour with meals. A fasting glucose above 100 mg/dL is borderline, above 126 mg/dL on two occasions is diagnostic of diabetes, and a random glucose above 200 with symptoms is also diagnostic regardless of fasting. HbA1c estimates average blood sugar over the prior two to three months by measuring the percentage of hemoglobin that has glucose stuck to it; under 5.7% is normal, 5.7–6.4% is prediabetes, and 6.5% or higher is diabetes.
The two together tell a complementary story: glucose catches the current moment, HbA1c catches the trend. Many patients focus on HbA1c because it is the more stable number, but a sudden change in either deserves a conversation about what shifted, and the medical AI walkthrough of how these values are interpreted gives a sense of how a clinical-grade reader weighs the two together.
Lipids: LDL Cholesterol Is the One That Drives Decisions
A standard lipid panel includes total cholesterol, LDL, HDL, and triglycerides. The decision-making number is LDL, because it is the particle most directly implicated in artery-clogging plaque and the one most aggressively lowered in people at higher cardiovascular risk. The optimal LDL target is not one-size-fits-all; for a 35-year-old with no risk factors it can be well under 130, while a 65-year-old with diabetes and prior heart disease is often pushed under 70, sometimes under 55.
Triglycerides respond quickly to recent meals and alcohol; HDL is the 'good' carrier, though very high HDL is not necessarily protective and very low HDL is a risk marker. The LDL cholesterol target by age article lays out the targets and the lifestyle levers that actually move them over months, not days.
Thyroid: TSH and the Free T4 It Controls
Thyroid-stimulating hormone (TSH) is the pituitary's report on whether the thyroid is keeping up. A high TSH means the thyroid is underactive and the pituitary is shouting at it; a low TSH means the thyroid is overactive and the pituitary is trying to back off. Free T4 is the actual thyroid hormone level, and the two together localize the problem: a high TSH with a low free T4 is overt hypothyroidism, while a slightly elevated TSH with a normal free T4 is subclinical and often watched rather than treated.
Thyroid antibodies matter when the cause is autoimmune, because that changes the long-term trajectory. The thyroid antibody test guide covers TPO and TgAb and what elevated antibodies mean for risk over the next decade.
Vitamins: Vitamin D as the Stand-In
Of the vitamins tested on routine blood work, vitamin D (specifically 25-OH vitamin D) is the one that shows up most often and drives the most decisions. Levels below 20 ng/mL are frankly deficient, 20–30 is insufficient, and 30–60 is the typical target. Supplementation is cheap and well-tolerated at standard doses, which is part of why testing and correcting is so common; the harder question is which symptoms actually improve when a low value is corrected, and the answer is mostly musculoskeletal and falls-related rather than the long list of conditions vitamin D has been linked to over the years.
B12 and folate are sometimes ordered alongside, especially in older adults or anyone with macrocytic anemia. For the full D story, the vitamin D deficiency test results guide walks through what each range means and how aggressively to supplement.
How to Read These Twelve as a System
A single value out of range is rarely a diagnosis. A pattern across values is closer to one. Mild anemia plus a low ferritin is iron deficiency until proven otherwise; mild anemia plus a high ferritin and high ALT is more concerning and points at a different workup. Prediabetes plus a low HDL plus a high triglyceride is metabolic syndrome, and the response is dietary and activity changes that move all three numbers at once. The list of patterns is long, but the principle is short: the report is a system, not a checklist.
This is also where AI-assisted lab interpretation earns its keep. A clinical-grade reader weighs the values together, flags combinations that match known patterns, and surfaces the questions to bring to your clinician. The I Ran My Lab Results Through AI post walks through what that looks like in practice, and the Why Two Doctors Read the Same Lab Results Differently article explains why even trained humans disagree on edge cases. If you want a sanity check on a result before your next appointment, the free AI Blood Test Interpretation tool is the fastest place to start.
| Number | Target range | Why it is on this list |
|---|---|---|
| Hemoglobin | 12-17.5 g/dL | Screens for anaemia, the most common finding in primary care |
| MCV | 80-100 fL | Separates iron-deficiency anaemia from anaemia of chronic disease |
| Platelets | 150,000-450,000 /uL | Bleeding and clotting risk in one number |
| eGFR | 90+ mL/min/1.73m2 | The single best summary of kidney function |
| Creatinine | 0.7-1.3 mg/dL | Read alongside eGFR because muscle mass skews it |
| ALT | 7-56 U/L | Most sensitive routine marker of liver inflammation |
| AST | 10-40 U/L | Liver plus heart and muscle, so it needs context |
| Fasting glucose | 70-99 mg/dL | The moment blood sugar handling is easiest to judge |
| HbA1c | Below 5.7% | Three-month average glucose, catches what fasting misses |
| LDL cholesterol | Below 100 mg/dL | The lipid that drives most clinical decisions |
| HDL cholesterol | 40+ mg/dL (men), 50+ (women) | The protective counterweight to LDL |
| TSH | 0.4-4.0 mIU/L | The master switch for thyroid function |
What to Bring to Your Next Appointment
Two questions earn their keep at any lab follow-up. First, which of these twelve numbers changed the most since my last result, and is the change in the right direction? Second, of the values that are still out of range, which one would you act on first if you were the one deciding? Those two questions force the visit to focus on the numbers that actually drive the next decision, instead of walking through every line on the report.
The How to Read Lab Panels Safely at Home guide and the How to Understand Your Lab Report Before Your Appointment walkthrough both pair with this list. For a higher-level view of which tests are worth asking for and which are not, the Five Blood Tests That Could Save Your Life article is the shortest path.
Ready to try Premedice?
Get instant, AI-powered explanations of your lab results and symptoms — powered by 300+ medical databases.
Continue Reading



Most Popular
Best AI Medical Models in 2026: MedQA Scores Compared
ResearchMedGemma: Open-Source Medical AI That Runs on Your Hardware
TechnologyMed-PaLM 2: 86.5% MedQA Score, Zero Doctors Using It (2026)
ResearchAI Symptom Checker Architecture: How Premedice Cuts Hallucinations 3.8x
TechnologyMedical AI Privacy: AES-256 + Zero-Knowledge Architecture
SecurityDr. Marcus Vance, MD
Dr. Vance is a board-certified internal medicine physician and clinical informatics expert with a focus on preventative medicine and patient-directed health literacy.
Expert Takeaway
Think of these twelve numbers as the vital signs of your blood. Most of the time they are reassuring, sometimes they are noisy, and occasionally one of them catches a problem early enough to act on. Learn what each measures, learn what your personal baseline was last time, and bring the questions the lab portal cannot answer to a clinician who has time to look at the full picture.
Browse by Topic
QFrequently Asked Questions
Q1How many numbers on a blood test actually matter?
On a standard adult panel, about twelve numbers carry most of the clinical signal: hemoglobin, hematocrit, white blood cell count, platelets, eGFR, creatinine, ALT, AST, glucose, HbA1c, LDL cholesterol, and TSH. Vitamin D is a useful thirteenth. Everything else is either redundant, specialty-specific, or interpretable only in the context of those twelve.
Q2Is being in the normal range the same as being healthy?
No. Reference ranges are population statistics; they describe where 95% of healthy people fall, which means 5% of healthy people fall outside. Optimal ranges are tighter, and a value in the 'normal' band can still be moving in the wrong direction. Trends across two or three reports are usually more informative than any single number.
Q3What is the most important number on a blood test?
For long-term disease risk, the three that drive the most decisions are HbA1c, LDL cholesterol, and eGFR, because they predict the chronic conditions — diabetes, heart disease, and kidney disease — that cause most preventable adult illness. For acute issues, hemoglobin and the white blood cell count catch anemia and infection first.
Q4Why are my reference ranges different from someone else's?
Reference ranges are calibrated to the lab's own population and adjusted for age and sex. Children, pregnant people, athletes, and older adults have ranges that differ from a healthy 30-year-old's. A 'normal' flag on your report is the lab's population reference, not necessarily your personal optimal.
Q5Should I be worried if one number is slightly out of range?
Usually not by itself. Small excursions are common and frequently reflect hydration, recent meals, time of day, or a transient infection. The right response is a repeat test in four to twelve weeks, not a panic or a specialty referral. Worry grows when a value is far out of range, when several related values are off together, or when the change is large from your prior baseline.
Q6Can AI help me read my lab results?
Yes, for the orientation step. A clinical-grade AI reader like Premedice can walk you through what each marker measures, flag combinations that match known patterns, and surface the questions worth bringing to a clinician. It is not a diagnosis, and a flagged value always needs a human in the loop before any clinical decision. For a quick check, the free AI Blood Test Interpretation tool runs the basics in under a minute.
Q7How often should I get a blood test?
For healthy adults, an annual panel is the common baseline. People with known conditions — diabetes, kidney disease, cardiovascular risk — test more often, sometimes every three months, to monitor treatment. The right cadence is the one your clinician recommends for your specific situation; this article is for understanding the numbers, not setting the schedule.
Verified References & Literature
Reference Ranges and What They Mean: Lab Medicine Best Practices
American Association for Clinical Chemistry, 2024
View SourceKDIGO 2024 Clinical Practice Guideline for the Evaluation and Management of Chronic Kidney Disease
Kidney International, 2024
View Source2018 AHA/ACC/AACVPR/AAPA/ABC/ACPM/ADA/AGS/APhA/ASPC/NLA/PCNA Guideline on the Management of Blood Cholesterol
Circulation, 2019
View SourceGet a structured second read in seconds
Upload lab results, describe symptoms, or ask about a diagnosis — Premedice gives you medically-grounded answers backed by 30+ clinical databases.